Páginas

Covid, iniciación a análisis de datos y Python

Les dejo una charla que tuve por chat con una compañera del trabajo acerca de aprender Python y de cómo hice esto que está en mi repo acerca del estado del COVID en Argentina y espero que sirva de inspiración para alguien.

Yo de python no se mucho pero busco en internet como hacer las cosas y las adapto pero amen de no saber la sintanxis, si conocia algunas cosas que son las que preguntas vos como "conceptos"

Yo creo que mas q aprender python, que es como aprender cualquier lenguaje, hay que aprender que ecosistema / librerias tiene python para realizar las tareas mas comunes y como funcionan.

Para manejar sets de datos, siempre se usa pandas, que es una librerias que crea una entidad en memoria y te permite manipularla de mil maneras y tiene muchas cosas de estadisticas ya metidas https://pandas.pydata.org/ Entonces al saber que pandas sirve para manipular datos, busco en google cosas como x ej python pandas load files from csv

Para graficar, se usa matplotlib.pyplot, https://matplotlib.org/3.2.1/api/_as_gen/matplotlib.pyplot.html  y hago lo mismo, busco en google: python plot linear graph https://www.google.com/search?q=python+plot+linear+graph&rlz=1C1GCEA_enAR875AR875&oq=python+plot+linear+graph&aqs=chrome..69i57.177j0j1&sourceid=chrome&ie=UTF-8

Y ahi te aparecen muchísimos blogs con info... lo que tiene python es una comunidad y librerías muy grande, asi que vas a encontrar info para todo.

Con esas 2 librerías hice la mayor parte de todo

Después cosas básicas, como x ej como hacer un request a una url en python

Otras librerías que se usan siempre son NumPy y SciPy que sirven para hacer operaciones cientificas con numeros, https://numpy.org/

Todas esas son tipo standar que luego te sirve como input para los FWKs de AI

Uno de los mas faciles y mas usados en https://scikit-learn.org/stable/

Con solo esto, vas a podes hacer muchisisisisismas cosas de AI, analisis de datos, etc...

Después si te queres conectar a una BD SQL Server x ej, buscas como se hace y el resultado lo metes en un dataframe de PANDAS (la lib que te comentaba al principio)

Para hacer pruebas siempre te conviene usar jupyter notebooks (que son esos que viste en mi repo), te lo podes instalar todo localmente mediante el entorno https://www.anaconda.com/ o usas https://colab.research.google.com/ que ya esta todo hosteado en la nube y no tenes que instalar ni pelearte con nada, azure tiene lo mismo https://notebooks.azure.com/

Para hacer cosas básicas y empezar, los planes gratis te sirven y te bastan... y si necesitas mas power, pagas o instalas todo en tu máquina local

Para mi todo esto que te explique es el verdadero valor y poder de python...

AI notes

Here you have some notes I took during my AI learning path. They are what they are .. just simple useful notes. Enjoy them!

What is machine learning?

Machine learning is often thought to mean the same thing as AI, but they aren’t actually the same. AI involves machines that can perform tasks characteristic of human intelligence. AI can also be implemented by using machine learning, in addition to other techniques.


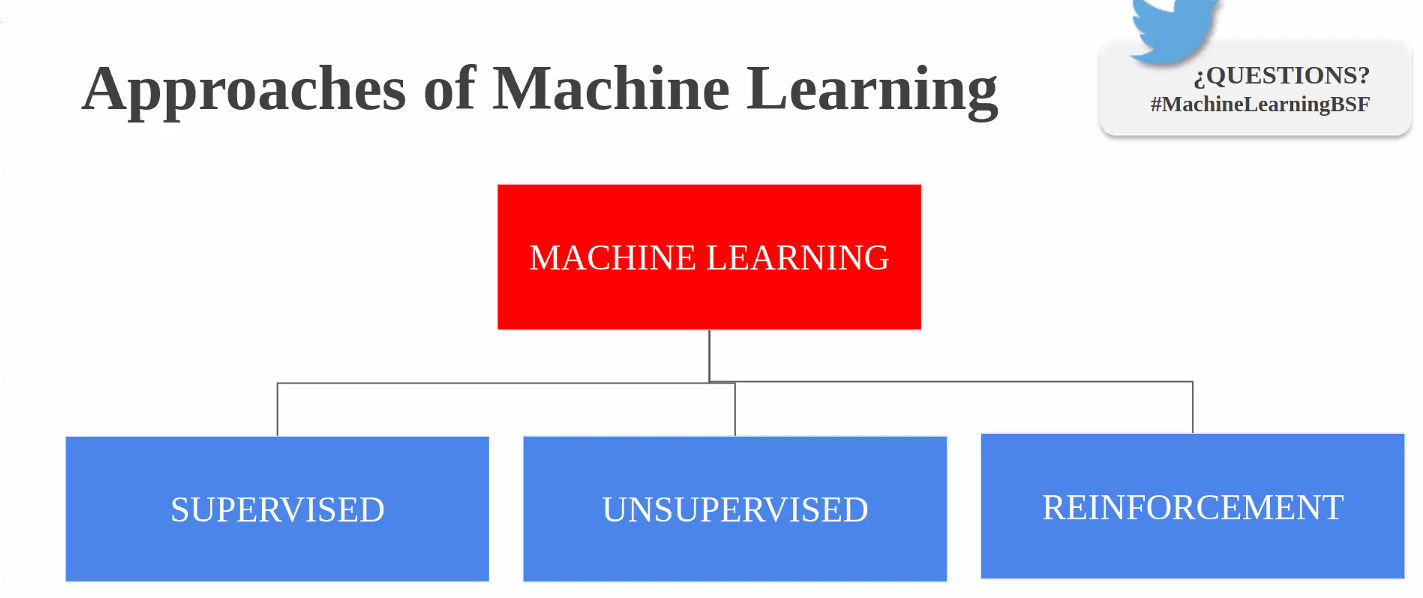
Machine learning itself is a field of computer science that gives computers the ability to learn without being explicitly programmed. Machine learning can be achieved by using one or multiple algorithm technologies, like neural networks, deep learning, and Bayesian networks.


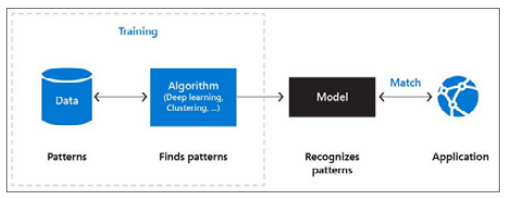
The machine learning process works as follows:
  • Data contains patterns. You probably know about some of the patterns, like user ordering habits. It’s also likely that there are many patterns in data with which you’re unfamiliar.
  • The machine learning algorithm is the intelligent piece of software that can find patterns in data. This algorithm can be one you create using techniques like deep learning or supervised learning.
  • Finding patterns in data using a machine learning algorithm is called “training a machine learning model.” The training results in a machine learning model. This contains the learnings of the machine learning algorithm.
  • Applications use the model by feeding it new data and working with the results. New data is analyzed according to the patterns found in the data. For example, when you train a machine learning model to recognize dogs in images, it should identify a dog in an image that it has never seen before.
The crucial part of this process is that it is iterative. The machine learning model is constantly improved by training it with new data and adjusting the algorithm or helping it identify correct results from wrong ones.

Visualising datasets

The first step around any data related challenge is to start by exploring the data itself. This could be by looking at, for example, the distributions of certain variables or looking at potential correlations between variables.

The problem nowadays is that most datasets have a large number of variables. In other words, they have a high number of dimensions along which the data is distributed. Visually exploring the data can then become challenging and most of the time even practically impossible to do manually. However, such visual exploration is incredibly important in any data-related problem. Therefore it is key to understand how to visualise high-dimensional datasets. This can be achieved using techniques known as dimensionality reduction. This post will focus on two techniques that will allow us to do this: PCA and t-SNE.

https://towardsdatascience.com/visualising-high-dimensional-datasets-using-pca-and-t-sne-in-python-8ef87e7915b

Prepare data

A dataset usually requires some preprocessing before it can be analyzed. You might have noticed some missing values when visualizing the dataset. These missing values need to be cleaned so the model can analyze the data correctly.

Basics of Entity Resolution with Python and Dedupe

https://medium.com/district-data-labs/basics-of-entity-resolution-with-python-and-dedupe-bc87440b64d4

Categorical columns

  • Features which have some order associated with them are called ordinal features.
  • Features without any order of precedence are called nominal features.
  • There are also continuous features. These are numeric variables that have an infinite number of values between any two values. A continuous variable can be numeric or a date/time.
Use Category Encoders to improve model performance when you have nominal or ordinal data that may provide value.
  • For ordinal columns try Ordinal (Integer), Binary, OneHot, LeaveOneOut, and Target. Helmert, Sum, BackwardDifference and Polynomial are less likely to be helpful, but if you have time or theoretic reason you might want to try them.
With only three levels, the information embedded becomes muddled. There are many collisions and the model can’t glean much information from the features. Just one-hot encode a column if it only has a few values. In contrast, binary really shines when the cardinality of the column is higher — with the 50 US states, for example.
  • For nominal columns try OneHot, Hashing, LeaveOneOut, and Target encoding. Avoid OneHot for high cardinality columns and decision tree-based algorithms.
For nominal data a hashing algorithm with more fine-grained control usually makes more sense. If you’ve used binary encoding successfully, please share in the comments. HashingEncoder implements the hashing trick. It is similar to one-hot encoding but with fewer new dimensions and some info loss due to collisions.
  • For regression tasks, Target and LeaveOneOut probably won’t work well.
https://www.datacamp.com/community/tutorials/categorical-data

https://towardsdatascience.com/smarter-ways-to-encode-categorical-data-for-machine-learning-part-1-of-3-6dca2f71b159

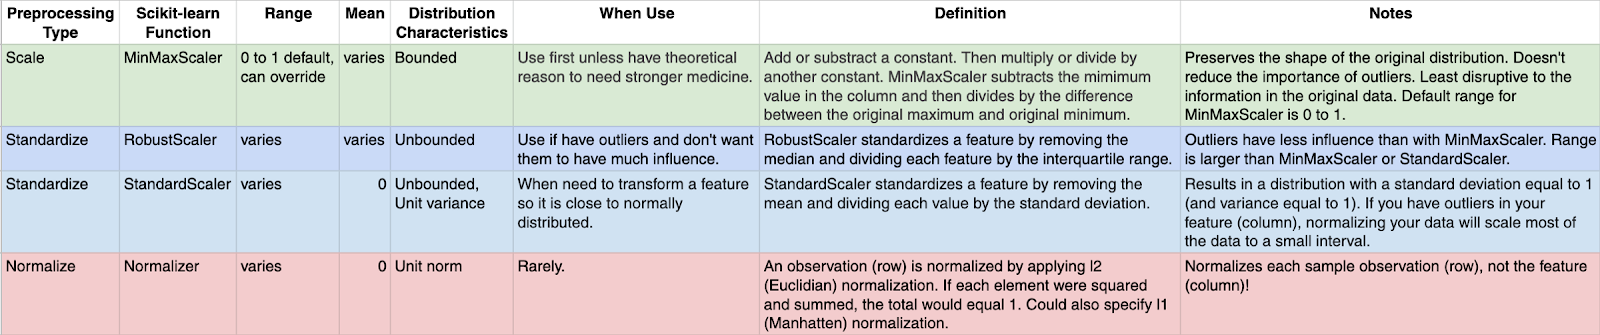
Values normalization

Many machine learning algorithms work better when features are on a relatively similar scale and close to normally distributed. MinMaxScaler, RobustScaler, StandardScaler, and Normalizer are scikit-learn methods to preprocess data for machine learning.

https://towardsdatascience.com/scale-standardize-or-normalize-with-scikit-learn-6ccc7d176a02


Synthetic data generation — a must-have skill for new data scientists

A brief rundown of methods/packages/ideas to generate synthetic data for self-driven data science projects and deep diving into machine learning methods.

https://towardsdatascience.com/synthetic-data-generation-a-must-have-skill-for-new-data-scientists-915896c0c1ae

https://github.com/tirthajyoti/Machine-Learning-with-Python/blob/master/Synthetic_data_generation/Synthetic-Data-Generation.ipynb?source=post_page---------------------------

Pipeline in Machine Learning with Scikit-learn

Definition of pipeline class according to scikit-learn is “Sequentially apply a list of transforms and a final estimator. Intermediate steps of pipeline must implement fit and transform methods and the final estimator only needs to implement fit.”

https://towardsdatascience.com/a-simple-example-of-pipeline-in-machine-learning-with-scikit-learn-e726ffbb6976

Testing the Neural Network

Precision, recall, and the f1-score


Given the following results:

precision recall f1-score support

0 0.76 0.78 0.77 650

1 0.98 0.96 0.97 1990

2 0.91 0.94 0.92 452

3 0.99 0.84 0.91 370

4 0.82 0.77 0.79 725

5 0.93 0.98 0.95 2397

avg / total 0.92 0.92 0.92 6584

Here is a brief recap of what those scores mean:

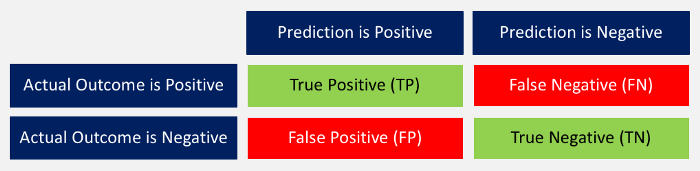
“Prediction versus Outcome Matrix” by Nils Ackermann is licensed under Creative Commons CC BY-ND 4.0
  • Accuracy: The ratio between correctly predicted outcomes and the sum of all predictions. ((TP + TN) / (TP + TN + FP + FN))
  • Precision: When the model predicted positive, was it right? All true positives divided by all positive predictions. (TP / (TP + FP))
  • Recall: How many positives did the model identify out of all possible positives? True positives divided by all actual positives. (TP / (TP + FN))
  • F1-score: This is the weighted average of precision and recall. (2 x recall x precision / (recall + precision))
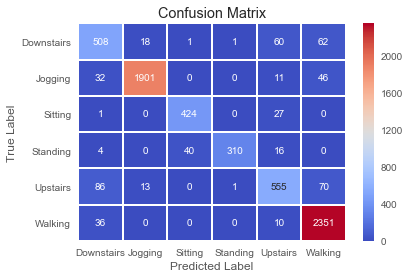
The associated confusion matrix against the test data looks as following.


Explainability on a Macro Level with SHAP

The whole idea behind both SHAP and LIME is to provide model interpretability. I find it useful to think of model interpretability in two classes — local and global. Local interpretability of models consists of providing detailed explanations for why an individual prediction was made. This helps decision makers trust the model and know how to integrate its recommendations with other decision factors. Global interpretability of models entails seeking to understand the overall structure of the model. This is much bigger (and much harder) than explaining a single prediction since it involves making statements about how the model works in general, not just on one prediction. Global interpretability is generally more important to executive sponsors needing to understand the model at a high level, auditors looking to validate model decisions in aggregate, and scientists wanting to verify that the model matches their theoretical understanding of the system being studied.

https://blog.dominodatalab.com/shap-lime-python-libraries-part-2-using-shap-lime/

Shap explanation and its graphs
https://towardsdatascience.com/interpretable-machine-learning-with-xgboost-9ec80d148d27

Windows Server Core ltsc2019 Docker image on Windows 10 1803: no matching manifest for windows/amd64 10.0.17134 in the manifest list entries


I'm trying to create a Windows Server Core ltsc2019 Docker image on Windows 10 1803 and when trying to get the docker image from the registry I'm getting

$ docker run mcr.microsoft.com/windows/servercore:ltsc2019
Unable to find image 'mcr.microsoft.com/windows/servercore:ltsc2019' locally
ltsc2019: Pulling from windows/servercore
docker: no matching manifest for windows/amd64 10.0.17134 in the manifest list entries.

Searching the Internet I came with the solution, "your pulling image must match the version of Windows that you're runninghttps://github.com/docker/for-win/issues/3761#issuecomment-498315046 

And the explanation is simple (and also on that thread) "the version must match the Windows kernel version you're running on. Unlike Linux, the Windows kernel does not have a stable API, so container images running on Windows must have libraries that match the kernel on which they will be running to make it work (which is also why those images are a lot bigger than Linux images).https://github.com/docker/for-win/issues/3761#issuecomment-484131393 

Aplicando practicas modernas de desarrollo a proyectos hosteados en TFS / legacy

Si me preguntan cuáles son las prácticas que deberían aplicarse a un proyecto de desarrollo de software hoy en día, sin importar su tamaño, yo rápidamente respondería:

  1. Utilización de containers para levantar entornos de trabajo. 
  2. Código versionado en herramienta moderna. Hoy en día el estandar de la industria es GIT
  3. Aplicar refactorización a ese código.
  4. Que ese código tenga una buena cobertura.
  5. Integrar las modificaciones al código continuamente y que un server compile el código y verifique que no haya roto nada.
  6. Hace un análisis de mi código que me asegure que sigo standard, que me de métricas sobre mi código, etc.
  7. Test automatizados
  8. Delivery / deploy automatizado y continuo

Y si me apuran aún mas, respondo "como mínimo integrar las modificaciones al código continuamente y que un server compile el código y verifique que no haya roto nada" aunque a veces en mucho pedir.

Ahora, déjenme que les cuente una historia a ver si les suena familiar.

Este año me sume a trabajar a un equipo que desarrollaba una aplicación web para un cierto cliente. El código ha sido tocado por mucha gente, de distintos senorities y ni hablar de los errores inexplicables que se encuentran  o del código dulpicado que hay.

El código fuente del proyecto estaba hosteado en el TFS del cliente con un Jenkins build server y deploy server (que no controlamos). Este build server no está configurado como integración continua

El Jenkins ejecuta un análisis de código con SonarQube aunque tampoco tenemos acceso. El acceso a los análisis de SonarQube nos serviría para tener métricas de nuestro código, ver como evoluciona / involuciona y ayudaría a los desarrolladores más juniors a que aprendan y mejoren.

A pesar que no hacemos TDD (y que la arquitectura de app no lo permite), hay algunos unit test escritos que nunca se ejecutan.

Conclusión: casi ninguno de los puntos nombrados al principio se cumplen.

¿Seguimos desarrollando así? la respuesta es muy simple NOOOOOOOOOOOO
¿Qué opciones tengo? ahi la cosa es más compleja pero nada complicado gracias a la cantidad de herramientas con las que contamos hoy en día:

  1. Utilizar un GIT controlado por nosotros y luego integremos los cambios en el TFS. Esto es facil de hacer con GIT TFS, un comando que nos permite clonar en un repo GIT el código fuente hosteado en un TFS y tener una comunicación bidireccional. Una vez que controlamos el repo, el resto es más facil!
  2. Como integración continua podemos usar algo como Azure DevOPS para que buildee el código continuamente y ejecute las tareas que necesitamos:

Ya con el hecho de usar GIT TFS y Azure DevOPS junto a los Unit Test y SonarQube logramos tener mucho más de lo que originalmente teníamos y hemos mejorado notablemente nuestra calidad.

Asp.Net Core + GraphQL + Docker + Github + AzureDevOps + SonarQube

This project was created to learn about GraphQL and to spread the learnings. You can find the related PPT http://bit.ly/NeorisGraphQLPPT

Project source code: https://github.com/vackup/AspNetCoreGraphQL/

The app runs on 2 docker containers, one for the React frontend and one for the Asp.Net Core GraphQL backend
The project is being built using Azure Devops build pipelines (http://devops.azure.com)


Continuous Code Inspection is being done by SonarQube (https://www.sonarqube.org/).
AspNetCoreGraphQL SonarCloud Dashboard https://sonarcloud.io/dashboard?id=vackup_AspNetCoreGraphQL


What's GraphQL?

GraphQL (https://graphql.org/) is a data query language and specification developed internally by Facebook in 2012 before being publicly open sourced in 2015.

It provides an alternative to REST-based architectures with the purpose of increasing developer productivity and minimizing amounts of data transferred.

GraphQL is used in production by hundreds of organizations of all sizes including Facebook, Credit Karma, GitHub, Intuit, PayPal, the New York Times and many more. https://graphql.org/users/

Some post for building GraphQL APIs with ASP.NET Core

Mi (primer) experiencia en las jornadas agiles latam 2019

En este post quiero compartir lo que tooooooooooodo lo que me dejo las jornadas Agiles Latam 2019 (https://twitter.com/agilesla) llevadas a cabo en mi ciudad Rosario, Argentina. Obviamente es un post que lo único que espera es aportar un granito de arena, no trata de ser perfecto, completo o excelente, simplemente aportar un poco de valor.

Sinceramente me llevo muchísimo más de lo que fui a buscar. Como siempre digo, las personas son todo!!! eso es lo más importante y lindo que me llevo... que hay muchísimos "locos" ahí afuera queriendo cambiar el mundo y trata de hacer de él un lugar mucho mejor! Ver como todo fluía con respeto y sinceridad, con ganas.. como las cosas se iban dando me voló la cabeza. Me llevo interacciones impresionantes, experiencias, charlas, demostrar que en mi ciudad se puede hacer evento de calidad internacional. Poder compartir con personas grosas de todo punto de vista cuya única finalidad era compartir su conocimiento, sea mucho o poco, pero solo compartir desinteresadamente.

Me fui con la cabeza aún más abiertas, yo siendo el mismo pero distinto a la vez, con muchas más ganas. Y debo confezar un gran cambio que ocurrió en mi: antes las actividades del tipo "habla con la persona que tenés al lado por 1 minuto de tal tema" las odiaba, me costaban y no les encontraba sentido. Hoy puedo decir que me encantan y cuando no hay de ese tipo de actividades, es como que me falta algo.

Manifiesto agiles latam

Dinámica de las charlas y agenda

Agenda completa https://agiles2019.sched.com/


Jueves

Del EGO sistema al ECO sistema


Del Egosistema al Ecosistema_RoseRestrepoV-TA.pptx

Desarrollo del liderazgo con #leadershipdancefloor


Empresas sin Jefes (Caso 10 Pines)

https://www.10pines.com/
  • No es cooperativa, es SRL, pero solo por figura pública, todo se decide entre todos. Toma de decisiones → Fue una evolución / iteración la forma en que se toman las decisiones de 6 a 80 empleados.
    • Decisiones triviales → usan Lumio (x ej: compra de cafeteras)
    • Decisiones importantes → pasaron del consenso (100% de acuerdo) a “nadie en desacuerdo” (quizá hay decisiones que no me importa y lo que decidan los demás me parece bien)
  • Reunión de roots (raíces, personas de más de 3 meses dentro de la compañia) para temas importantes
  • Números abiertos → todos saben todos los número de la compañía, sueldos incluidos y se autoregulan (ver próxima charla)
  • La mayoría son devs, sólo 3 de administración. Hay grupos que desempeñan funciones como x ej ventas, hardware, recruting, etc.
  • 50% de las ganancias se reparte como bono según fórmula (la fórmula la revisan todos los años)
  • Las personas que ingresan, están 3 meses sin asignación aprendiendo ya dentro de la empresa.
  • Todos los viernes los proyectos hacen tipo una daily global.
  • Aumentos de sueldos → cada uno se postula y necesita aval. Hubo casos de gente que rechazo el aumento porque consideraba que iba a ganar algo más que otro que consideraba que aportaba más
  • Confianza
  • Capacitación
  • Reunión anual donde se definen las cosas a hacer en el corto plazo, lo que quieren, lo que desean, retro general, etc

Receta para números abiertos en tu empresa (10 pines)

Viernes

Libros Latam

https://blog.nicopaez.com/2019/09/20/notas-de-la-sesion-de-libros-de-autores-latinoamericanos-en-agiles-2019/

https://docs.google.com/presentation/d/1ONsz-Wpjbl70nHyI2svpgy71_poepuvq8lnRs1dTo50/edit#slide=id.g34d96f1218_0_8

https://10pines.gitbook.io/desarrollo-de-software-agil-en-10pines/

Charlas para generar futuro


Open space xxl

Historias de los abuelos (Ing y otros) & #EffectiveScrum Menos reuniones y mejores resultados

Learning GraphQL using NodeJS

Motivation and background

Trying to learn GraphQL (https://graphql.org/) I found the "Code Challenge for Scoutbase" (https://medium.com/scoutbase/we-are-hiring-javascript-developers-e7833762a40d).

The drawback of the challenge was that I've never done a nodejs app but as I knew JS and I have many many years of experience building web apps (mainly .net) and I love to learn new thing, I decided to go for it!

So I went from nothing (0) using NodeJs, GraphQL, Sequelize, PostgreSQL to this in just a couple of hours.

Here you have the code (it's an MVP or a prototype) and the code challenge description
https://github.com/vackup/scoutbase-code-challenge-back-end/

The app is deployed to Azure through Azure pipelines.


The app is using an Azure Database for PostgreSQL.

You can access the Graphql playground here https://scoutbase-code-challenge-backend.azurewebsites.net/graphql


Helpful links


Back-end task of Code Challenge for Scoutbase

This task is for demonstrating your understanding of HTTP, GraphQL, Node.js and general API practices.

Instructions:

  1. Implement a Node.js-based server with raw http, Koa or Express.
  2. Add a /graphql endpoint serving the apollo-server or any other GraphQL implementation.
  3. Schema must be able to return proper response for the following public query:
    • { movies { title year rating actors { name birthday country directors { name birthday country } } } }
  4. Add support for the following mutation:
    • mutation createUser($username: String, $password: String) { createUser(username: $username, password: $password) { token user { id name } } }
  5. To expand on the number four, add a mutation-based authentication that accepts:
    • mutation login($username: String, $password: String) { login(username: $username, password: $password) { token user { id name } } }
  6. Authenticated users may request additional fields for the query used earlier. New scoutbase_rating field must return the a random string between 5.0-9.0:
    • { movies { scoutbase_rating title year rating actors { name birthday country directors { name birthday country } } } }
  7. /graphql must be accessible for external clients.
  8. End.